Ocean Navigator Dataset Descriptions
Ocean Prediction Systems
The Ocean Navigator is a data visualization tool that enables users to discover and view 2D and 3D ocean model output quickly and easily. The ocean model output is stored in NetCDF files. These files are self-describing and contain the 2D or 3D model output for one or more timesteps and one or more variables.
All model nowcast and forecast information is based on a hydrodynamic model and should be considered as computer-generated guidance. These are an estimate of the oceanographic environment (i.e. potential temperature, salinity and currents) and not directly measured in-situ observation of ocean conditions. Reanalysis products are developed to be as close as possible to collected ocean observations and in agreement with model physics, giving a backward looking description of the ocean environment.
For specific technical specifications of each forecast or reanalysis product, or to access source data, please consult the links provided.
ECCC Datasets
Global Ice Ocean Prediction System 1/4° Physics Analysis and Forecast Updated Daily (GIOPS)
The Global Ice-Ocean Prediction System (GIOPS) produces global sea ice and ocean analyses and 10 day forecasts daily. This product contains time-mean sea ice and ocean forecast fields interpolated to two grids. One of the grids is a 0.2° resolution regular latitude-longitude grid covering the global ocean (north of 80° S). The other grid is in north-polar stereographic projection with a 5-km spacing at the standard parallel 60° N and covers the Arctic Ocean and the neighbouring sub-polar seas. Data is available for 50 depths. The data files are in netCDF format and comply with the Climate and Forecast Conventions.
Variables available for 2D (surface) and 3D (along the model depth) may differ. For each of the models below the list of variables made available in the Ocean Navigator are listed. Derived variables are calculated on the fly by the Ocean Navigator application.
For more detail please see ECCC’s GIOPS documentation on MSC Open Data.
Source Data can be accessed on the HPFX Server under /timestamp/WXO-DD/model_giops/netcdf/lat_lon/.
Geographical Coverage: global ocean Spatial Resolution: 1/4 degree latitude and longitude Vertical Coverage: 50 levels ranging from 1 m to 250 m thickness at depth
GIOPS 10 Day Daily Mean Forecast 3D - LatLon
| Variables from source | Derived variables |
|---|---|
| water salinity (psu) | Speed of sound (m) |
| water east velocity (m/s) | sonic layer depth (m) |
| water north velocity (m/s) | sound channel axis (m) |
| critical depth (m) | |
| depth excess (m) | |
| potential sub-surface sound channel [no units] | |
| potential temperature (°C) | |
| water velocity (m/s) |
GIOPS 10 Day 3 Hour Mean Forecast Surface - LatLon
| Variables from source | Derived variables |
|---|---|
| Compressive Ice Strength (Nm-1) | Potential temperature (°C) |
| Ice Concentration (fraction) | Water Velocity (m/s) |
| Ice Volume (m) | |
| Internal Ice Pressure (Nm-1) | |
| Ocean Mixed Layer Depth (m) | |
| Salinity (psu) | |
| Sea Ice East Velocity (m/s) | |
| Sea Ice North Velocity (m/s) | |
| Sea Ice Velocity (m/s) | |
| Sea Surface Height (m) | |
| Snow Volume (cm) | |
| Surface Temp Over Sea Ice (°C) | |
| Turbocline Depth (m) | |
| Water East Velocity (m/s) | |
| Water North Velocity (m/s) | |
Regional Ice Ocean Prediction System (RIOPS) 1/12°
The Regional Ice Ocean Prediction System (RIOPS) provides 84 hour ice and ocean forecasts four times per day on a 1/12° resolution grid (3-8 km). RIOPS is initialized using analyses from the Global Ice-Ocean Prediction System (GIOPS). Atmospheric fluxes for 84 hour forecasts are calculated using fields from the Regional Deterministic Prediction System (RDPS).
Variables available for 2D (surface) and 3D (along the model depth) may differ. For each of the models below the list of variables made available in the Ocean Navigator are listed. Derived variables are calculated on the fly by the Ocean Navigator application.
Here is the link to the ECCC’s MSC Open Data for RIOPS: Readme riops datamart en - MSC Open Data / Données ouvertes du SMC (eccc-msc.github.io)
For more detail please see ECCC’s RIOPS documentation on MSC Open Data.
Source Data can be accessed on the HPFX Server under /timestamp/WXO-DD/model_riops/netcdf/forecast/polar_stereographic/.
Geographical Coverage: regional ocean Spatial Resolution: 1/4 degree latitude and longitude Vertical Coverage: 50 levels ranging from 1 m to 250 m thickness at depth
RIOPS Forecast 3D – Polar Stereographic
This is a 84 hour forecast with hourly 3D output.
| Variables from source | Derived variables |
|---|---|
| Salinity (psu) | Speed of sound (m) |
| Water East Velocity (m/s) | sonic layer depth (m) |
| Water North Velocity (m/s) | sound channel axis (m) |
| critical depth (m) | |
| potential sub-surface sound channel [no units] | |
| potential temperature (°C) | |
| water velocity (m/s) | |
RIOPS Forecast Surface – Polar Stereographic
This is a 84 hour forecast with hourly 2D output.
| Variables from source | Derived variables |
|---|---|
| Compressive Ice Strength (Nm-1) | Potential temperature (°C) |
| Ice Concentration (fraction) | Water Velocity (m/s) |
| Ice Volume (m) | |
| Internal Ice Pressure (Nm-1) | |
| Ocean Mixed Layer Depth (m) | |
| Salinity (psu) | |
| Sea Ice East Velocity (m/s) | |
| Sea Ice North Velocity (m/s) | |
| Sea Ice Velocity (m/s) | |
| Sea Surface Height (m) | |
| Snow Volume (cm) | |
| Surface Temp Over Sea Ice (°C) | |
| Turbocline Depth (m) | |
| Water East Velocity (m/s) | |
| Water North Velocity (m/s) |
CCG RIOPS Forecast Surface - LatLon
The product is a latlon 2D projection made from the RIOPS system over a domain covering the Canadians seas only.
| Variables from source | Derived variables |
|---|---|
| Ice Concentration (fraction) | Potential temperature (°C) |
| Ice Volume (m) | Water Velocity (m/s) |
| Salinity (psu) | |
| Sea Surface Height (m) | |
| Water East Velocity (m/s) | |
| Water North Velocity (m/s) | |
Coastal Ice Ocean Prediction System (CIOPS)
The ocean-ice forecasts from the CIOPS-East and CIOPS-West systems are available as hourly products. These products are available in NetCDF format on a latitude and longitude grid. The CIOPS-East domain covers the Gulf of St. Lawrence, the North West Atlantic and the east coast of Canada at a resolution of 2km (0.03 x 0.02 degree). The CIOPS-West main domain covers the North East Pacific and the west coast of Canada, also at a resolution of 2km (0.03 x 0.02 degree). The CIOPS-West system also outputs a regional enhancement at 500m resolution (0.008 x 0.005 degree) that covers the Salish Sea region only.
Variables available for 2D (surface) and 3D (along the model depth) may differ. For each of the models below the list of variables made available in the Ocean Navigator are listed. Derived variables are calculated on the fly by the Ocean Navigator application.
For more detail please see ECCC’s CIOPS documentation on MSC Open Data.
Source Data can be accessed on the HPFX Server under /timestamp/WXO-DD/model_ciops/.
CIOPS Forecast East 3D – LatLon
| Variables from source | Derived variables |
|---|---|
| Salinity (psu) | Potential temperature (°C) |
| Water East Velocity (m/s) | Water Velocity (m/s) |
| Water North Velocity (m/s) | Speed of sound (m) |
| sonic layer depth (m) | |
| sound channel axis (m) | |
| potential sub-surface sound channel [no units] | |
| potential temperature (°C) | |
| water velocity (m/s) | |
CIOPS Forecast East Surface – LatLon
| Variables from source | Derived variables |
|---|---|
| Compressive Ice Strength (Nm-1) | Potential temperature (°C) |
| Ice Concentration (fraction) | Water Velocity (m/s) |
| Ice Volume (m) | |
| Internal Ice Pressure (Nm-1) | |
| Ocean Mixed Layer Depth (m) | |
| Salinity (psu) | |
| Sea Ice East Velocity (m/s) | |
| Sea Ice North Velocity (m/s) | |
| Sea Ice Velocity (m/s) | |
| Sea Surface Height (m) | |
| Snow Volume (cm) | |
| Surface Temp Over Sea Ice (°C) | |
| Turbocline Depth (m) | |
| Water East Velocity (m/s) | |
| Water North Velocity (m/s) | |
CIOPS Forecast West 3D – LatLon
| Variables from source | Derived variables |
|---|---|
| Salinity (psu) | Potential temperature (°C) |
| Water East Velocity (m/s) | Water Velocity (m/s) |
| Water North Velocity (m/s) | Speed of sound (m) |
| sonic layer depth (m) | |
| sound channel axis (m) | |
| potential sub-surface sound channel [no units] | |
| potential temperature (°C) | |
| water velocity (m/s) | |
CIOPS Forecast West Surface – LatLon
| Variables from source | Derived variables |
|---|---|
| Compressive Ice Strength (Nm-1) | Potential temperature (°C) |
| Ice Concentration (fraction) | Water Velocity (m/s) |
| Ice Volume (m) | |
| Internal Ice Pressure (Nm-1) | |
| Ocean Mixed Layer Depth (m) | |
| Salinity (psu) | |
| Sea Ice East Velocity (m/s) | |
| Sea Ice North Velocity (m/s) | |
| Sea Ice Velocity (m/s) | |
| Sea Surface Height (m) | |
| Snow Volume (cm) | |
| Surface Temp Over Sea Ice (°C) | |
| Turbocline Depth (m) | |
| Water East Velocity (m/s) | |
| Water North Velocity (m/s) | |
CIOPS Forecast Salish Sea 3D – LatLon
| Variables from source | Derived variables |
|---|---|
| Salinity (psu) | Potential temperature (°C) |
| Water East Velocity (m/s) | Water Velocity (m/s) |
| Water North Velocity (m/s) | Speed of sound (m) |
| sonic layer depth (m) | |
| sound channel axis (m) | |
| potential sub-surface sound channel [no units] | |
CIOPS Forecast Salish Sea Surface - LatLon
| Variables from source | Derived variables |
|---|---|
| Ocean Mixed Layer Depth (m) | Potential temperature (°C) |
| Salinity (psu) | Water Velocity (m/s) |
| Sea Ice Velocity (m/s) | |
| Sea Surface Height (m) | |
| Snow Volume (cm) | |
| Surface Temp Over Sea Ice (°C) |
Port Ocean Prediction Systems (POPS)
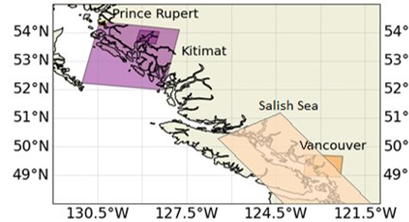
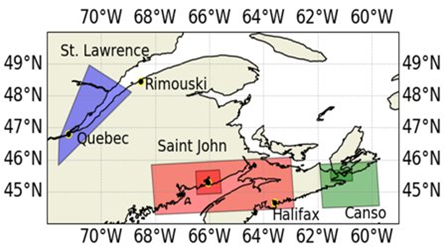
The Port Ocean Prediction Systems(POPS) produces 48 hours forecast daily and these products are available in NetCDF format on a latitude and longitude grid. The POPS system covers areas around six high priority ports with their domain names and resolutions listed as follows:
| Domain Names | Domain Full Name | Resolution |
|---|---|---|
| West Coast Ports | ||
| sss150 | South Salish Sea | ~130 m |
| vh20 | Vancouver Harbor | ~26 m |
| sf30 | Fraser River | ~30 m |
| kit100/kit500 | Kitimat and surrounding area | ~100 or ~500 m |
| East Coast Ports | ||
| stle200/stle500 | St. Lawrence River | ~200 or ~500 m |
| fundy500 | Bay of Fundy | ~500 m |
| sj100 | Port of Saint John | ~85 m |
| canso100/canso500 | Canso | ~100 or ~500 m |
Their domains of each port are shown below:
Variables for 2D (surface) available in the Ocean Navigator are listed. Derived variables are calculated on the fly by the Ocean Navigator application.
| Variable from source | Derived variables |
|---|---|
| Sea water temperature (K) | Water velocity (m/s) |
| Sea water salinity (psu) | |
| Sea water x velocity (m/s) | |
| Sea water y velocity (m/s) |
Source Data can be accessed on the HPFX Server under /dfo/pops_model/timestamp/.
The delivery of the POPS system is a best-effort service and a support line is available during business hours.
Global Deterministic Wave Prediction System (GDWPS)
The Global Deterministic Wave Prediction System (GDWPS) produces wave forecasts using the third generation spectral wave model WaveWatch III® (WW3). The model is forced by the 10 meters winds from the Global Deterministic Prediction System (GDPS). The GDPS forecast is a coupled atmosphere-ice-ocean model, its sea ice forecast is used by the GDWPS forecast to dampen or suppress wave growth in areas covered respectively with 25% to 75% and more than 75% ice. WW3 (WAVEWATCH III® Development Group, WW3DG 2019) is a third generation spectral wave prediction model that solves the evolution of the energy balance equation for the 2-D wave energy spectrum without any prior assumptions on the shape of the spectrum. The WW3 model has been implemented by a growing number of national operational forecasting centres over the last several years.
For more detail please see ECCC’s GDWPS documentation on MSC Open Data.
Source Data can be accessed on the HPFX Server under /timestamp/WXO-DD/model_gdwps/25km/.
| Variables from source | Derived variables |
|---|---|
| Mean wave direction of first swell partition (degrees) | NA |
| Mean wave direction of second swell partition (degrees) | |
| Mean zero-crossing wave period (s) | |
| Peak wave direction (degrees) | |
| Peak wave period (s) | |
| Peak wave period of first swell partition (s) | |
| Peak wave period of second swell partition (s) | |
| Significant wave height of combined wind waves and swell (m) | |
| Significant wave height of first swell partition (m) | |
| Significant wave height of second swell partition (m) | |
| Significant wave height of wind waves (m) | |
| Wind velocity (m/s) | |
| Wind wave direction (degrees) | |
| U component of wind (m) | |
| V component of wind (m) | |
Water Cycle Prediction System (WCPS)
The Water Cycle Prediction System (WCPS) simulates the complete water cycle, following the water as it moves from the atmosphere to the surface, through the river network and into lakes, and back to the atmosphere. It provides short-term analysis and forecasts of atmosphere-ocean-ice and river flows. WCPS was originally implemented over the Laurentian Great Lakes and St. Lawrence River watershed in support of Canada’s obligations under the Boundary Waters Treaty (International Joint Commission 2016). Starting from WCPS v3.0.0, the domain is extended to cover also the Gulf of St. Lawrence ocean region.
WCPS consists of three components: Pseudo_analysis component with the ocean-ice model NEMO-CICE, Forecast component with the limited area version of the atmospheric model GEM (GEM-LAM) coupled with NEMO-CICE and Rivers component with the river routing model WATROUTE. These components are coupled to each other, representing processes in the atmosphere, at the land surface and in the soil (at 10 km resolution), in large bodies of water and marine ice (at 1-km resolution), and in rivers (at 1-km resolution).
The Global Deterministic Prediciton System (GDPS) provides initial and boundary conditions to GEM-LAM covering the eastern North America, which includes the oceanic area surrounding the Gulf of St. Lawrence. Every 6 minutes, GEM-LAM communicates with NEMO-CICE of the precipitation that has landed on the surface of the lakes and of the state of the near-surface atmosphere over the Great Lakes (Lakes Superior, Michigan-Huron, St. Claire, Erie, and Ontario) and over the Gulf of St. Lawrence region. NEMO informs GEM-LAM of the surface water temperature, the extent of the ice cover, and the fluxes of latent and sensible heat and momentum. GEM-LAM also provides hourly estimates of surface runoff to WATROUTE. In turn, WATROUTE informs NEMO of the terrestrial runoff.
For more detail please see ECCC’s WCPS documentation on MSC Open Data.
Source Data can be accessed on the HPFX Server under /timestamp/WXO-DD/model_gdwps/25km/.
Derived variables are calculated on the fly by the Ocean Navigator application.
| Variables from source | Derived variables |
|---|---|
| Compressive Ice Strength (Nm-1) | Potential temperature (°C) |
| Ice Concentration (fraction) | Water Velocity (m/s) |
| Internal Ice Pressure (Nm-1) | |
| Ocean Mixed Layer Depth (m) | |
| Sea Ice East Velocity (m/s) | |
| Sea Ice North Velocity (m/s) | |
| Sea Ice Velocity (m/s) | |
| Sea Ice volume (m) | |
| Sea Surface Height (m) | |
| Surface Wind Velocity (m/s) | |
| Surface Air Temperature (°C) | |
| Surface Wind East Velocity (m/s) | |
| Surface Wind West Velocity (m/s) | |
| Water East Velocity (m/s) | |
| Water North Velocity (m/s) | |
Copernicus Marine Service Datasets
Global Ocean Physics Reanalysis (GLOBAL_MULTIYEAR_PHY_001_030)
The GLORYS12V1 product is the CMEMS global ocean eddy-resolving (1/12° horizontal resolution, 50 vertical levels) reanalysis covering the altimetry (1993 onward). It is based largely on the current real-time global forecasting CMEMS system. The model component is the NEMO platform driven at surface by ECMWF ERA-Interim then ERA5 reanalyses for recent years. Observations are assimilated by means of a reduced-order Kalman filter. Along track altimeter data (Sea Level Anomaly), Satellite Sea Surface Temperature, Sea Ice Concentration and In situ Temperature and Salinity vertical Profiles are jointly assimilated. Moreover, a 3D-VAR scheme provides a correction for the slowly-evolving large-scale biases in temperature and salinity.
This product includes daily and monthly mean files for temperature, salinity, currents, sea level, mixed layer depth and ice parameters from the top to the bottom. The global ocean output files are displayed on a standard regular grid at 1/12° (approximatively 8 km) and on 50 standard levels. Derived variables are calculated on the fly by the Ocean Navigator application.
For more information and data access please see the Copernicus Marine Data Store.
Copernicus Marine Service Global Ocean 1/12 deg Physics Reanalysis (Daily)
| Variables from source | Derived variables |
|---|---|
| Ocean Mixed Layer Depth (m) | Potential temperature (°C) |
| Salinity (psu) | Water Velocity (m/s) |
| Sea Floor Temperature (°C) | |
| Sea Ice Concentration (fraction) | |
| Sea Ice East Velocity (m/s) | |
| Sea Ice North Velocity (m/s) | |
| Sea Ice Thickness (m) | |
| Sea Ice Velocity (m/s) | |
| Sea Surface Height (m) | |
| Water East Velocity (m/s) | |
| Water North Velocity (m/s) |
Copernicus Marine Service Global Ocean 1/12 deg Physics Reanalysis (Monthly)
| Variables from source | Derived variables |
|---|---|
| Ocean Mixed Layer Depth (m) | Potential temperature (°C) |
| Salinity (psu) | Water Velocity (m/s) |
| Sea Floor Temperature (°C) | |
| Sea Ice Concentration (fraction) | |
| Sea Ice East Velocity (m/s) | |
| Sea Ice North Velocity (m/s) | |
| Sea Ice Thickness (m) | |
| Sea Ice Velocity (m/s) | |
| Sea Surface Height (m) | |
| Water East Velocity (m/s) | |
| Water North Velocity (m/s) |
Climatology calculated from GLOBAL REANALYSIS PHY 001_030
The monthly, seasonal and annual climatology were calculated using the GLORYS 1/12° Physics Reanalysis model.
The scripts used to generate these derived datasets are available through the Ocean Navigator GitHub page.
Temporal Resolution monthly - average conditions for each month from 1993 to 2018.
In developing the climatology, efforts were made to follow CF conventions for reporting climatological times. Please see script modify_time.py
CMEMS Global Ocean PHYS Reanalysis Climatology 1/12 deg
This dataset contains an annual mean generated for years 1996-2019.
| Variables from source | Derived variables |
|---|---|
| Ocean Mixed Layer Depth (m) | Potential temperature (°C) |
| Salinity (psu) | Water Velocity (m/s) |
| Sea Floor Temperature (°C) | |
| Sea Ice Concentration (fraction) | |
| Sea Ice East Velocity (m/s) | |
| Sea Ice North Velocity (m/s) | |
| Sea Ice Thickness (m) | |
| Sea Ice Velocity (m/s) | |
| Sea Surface Height (m) | |
| Water East Velocity (m/s) | |
| Water North Velocity (m/s) |
CMEMS Global Ocean PHYS Reanalysis Climatology (Monthly mean) 1/12 deg
| Variables from source | Derived variables |
|---|---|
| Ocean Mixed Layer Depth (m) | Potential temperature (°C) |
| Salinity (psu) | Water Velocity (m/s) |
| Sea Floor Temperature (°C) | |
| Sea Ice Concentration (fraction) | |
| Sea Ice East Velocity (m/s) | |
| Sea Ice North Velocity (m/s) | |
| Sea Ice Thickness (m) | |
| Sea Ice Velocity (m/s) | |
| Sea Surface Height (m) | |
| Water East Velocity (m/s) | |
| Water North Velocity (m/s) |
CMEMS Global Ocean PHYS Reanalysis Climatology (Seasonal mean) 1/12 deg
Seasonal Temporal resolution
| Season | Time period included |
|---|---|
| Winter (DJF) | averaged over December , January, and February 1994 to 2018 ( December is 1993 to 2017 for seasonal consistency) |
| Spring (MAM) | averaged over March, April, and May 1994 to 2018 |
| Summer (JJA) | averaged over June, July, and August 1994 to 2018 |
| Fall (SON) | averaged over September, October, November 1994 to 2018 |
| Variables from source | Derived variables |
|---|---|
| Ocean Mixed Layer Depth (m) | Potential temperature (°C) |
| Salinity (psu) | Water Velocity (m/s) |
| Sea Floor Temperature (°C) | |
| Sea Ice Concentration (fraction) | |
| Sea Ice East Velocity (m/s) | |
| Sea Ice North Velocity (m/s) | |
| Sea Ice Thickness (m) | |
| Sea Ice Velocity (m/s) | |
| Sea Surface Height (m) | |
| Water East Velocity (m/s) | |
| Water North Velocity (m/s) |
SalishSeaCast Datasets
For more information see the SalishSeaCast NEMO Model page.
SalishSeaCast 3D Biology
3d SMELT biological model field values averaged over 1 hour intervals from SalishSeaCast NEMO model runs with physics, biology and chemistry. The values are calculated for the entire model grid that includes Juan de Fuca Strait, the Strait of Georgia, Puget Sound, and Johnstone Strait on the coasts of Washington State and British Columbia. The time values are UTC. They are the centre of the intervals over which the calculated model results are averaged.
More information about this dataset, a web interface and an API for it, can be found on the SalishSeaCast ERDDAP server at https://salishsea.eos.ubc.ca/erddap/info/ubcSSg3DTracerFields1hV19-05/index.html
If you use this dataset in your research, please reference it with wording similar to the example below, and include citations of the publications below. Inclusion of the date(s) when you downloaded the dataset, and the dataset id help to ensure reproducibility of your work.
| Variables from source | Derived variables |
|---|---|
| Ammonium Concentration (mmol m-3) | N/A |
| Biogenic Silicon Concentration (mmol m-3) | |
| Mesodinium rubrum Concentration as Nitrogen (mmol m-3) | |
| Diatoms Concentration as Nitrogen (mmol m-3) | |
| Dissolved Organic Nitrogen Concentration (mmol m-3) | |
| Flagellates Concentration as Nitrogen (mmol m-3) | |
| Mesozooplankton Concentration as Nitrogen (mmol m-3) | |
| Microzooplankton Concentration as Nitrogen (mmol m-3) | |
| Nitrate Concentration (mmol m-3) | |
| Particulate Organic Nitrogen Concentration (mmol m-3) | |
| Silicon Concentration (mmol m-3) |
Reference wording:
3d SMELT biological model field values from the SalishSeaCast model (Soontiens et al, 2016; Moore-Maley et al, 2016; Soontiens and Allen, 2017; Olson et al, 2020) were downloaded from their ERDDAP server (https://salishsea.eos.ubc.ca/erddap/) on DATE from dataset ubcSSg3DBiologyFields1hV19-05.
Citations:
- Soontiens, N., Allen, S., Latornell, D., Le Souef, K., Machuca, I., Paquin, J.-P., Lu, Y., Thompson, K., Korabel, V., 2016. Storm surges in the Strait of Georgia simulated with a regional model. Atmosphere-Ocean 54 1-21. https://dx.doi.org/10.1080/07055900.2015.1108899
- Moore-Maley, B. L., Allen, S. E., and IansonD., 2016. Locally-driven interannual variability of near-surface pH and ΩA in the Strait of Georgia. J. Geophys. Res. Oceans, 121(3), 1600-1625. https://dx.doi.org/10.1002/2015JC011118
- Soontiens, N. and Allen, S., 2017. Modelling sensitivities to mixing and advection in a sill-basin estuarine system. Ocean Modelling, 112, 17-32. https://dx.doi.org/10.1016/j.ocemod.2017.02.008
- Olson, E. M., Allen, S. E., Do, Vy, Dunphy, M., and Ianson, D., 2020. Nutrient Supply by a Tidal Jet in the Salish Sea Based on a Highly Resolved Biogeochemical Model. Submitted in revised form to J. Geophys. Res. Oceans.
The SalishSeaCast project is supported by:
- The Marine Environmental Observation Prediction & Response network (MEOPAR)
- Ocean Networks Canada (ONC)
- Compute Canada
The Salish Sea MEOPAR NEMO model results are copyright by the Salish Sea MEOPAR Project Contributors and The University of British Columbia. They are licensed under the Apache License, Version 2.0. https://www.apache.org/licenses/LICENSE-2.0
SalishSeaCast 3D Currents
3d eastward (u) and northward (v) model current field values averaged over 1 hour intervals from SalishSeaCast NEMO model runs with physics, biology and chemistry. The values are calculated for the entire model grid that includes Juan de Fuca Strait, the Strait of Georgia, Puget Sound, and Johnstone Strait on the coasts of Washington State and British Columbia. The time values are UTC. They are the centre of the intervals over which the calculated model results are averaged.
More information about this dataset, a web interface and an API for it, can be found on the SalishSeaCast ERDDAP server at https://salishsea.eos.ubc.ca/erddap/info/ubcSSg3DTracerFields1hV19-05/index.html
| Variables from source | Derived variables |
|---|---|
| Eastward Current (m/s) | Speed of Current (m/s) |
| Westward Current (m/s) |
If you use this dataset in your research, please reference it with wording similar to the example below, and include citations of the publications below.Inclusion of the date(s) when you downloaded the dataset,and the dataset id help to ensure reproducibility of your work.
Reference wording:
3d eastward (u) and northward (v) model current field values from the SalishSeaCast model(Soontiens et al, 2016; Soontiens and Allen, 2017)were downloaded from their ERDDAP server (https://salishsea.eos.ubc.ca/erddap/) on DATE from dataset ubcSSg3DBiologyFields1hV19-05.
Citations
-
Soontiens, N., Allen, S., Latornell, D., Le Souef, K., Machuca, I., Paquin, J.-P., Lu, Y., Thompson, K., Korabel, V., 2016. Storm surges in the Strait of Georgia simulated with a regional model. Atmosphere-Ocean 54 1-21. https://dx.doi.org/10.1080/07055900.2015.1108899
-
Soontiens, N. and Allen, S., 2017. Modelling sensitivities to mixing and advection in a sill-basin estuarine system. Ocean Modelling, 112, 17-32. https://dx.doi.org/10.1016/j.ocemod.2017.02.008
The SalishSeaCast project is supported by:
- The Marine Environmental Observation Prediction & Response network (MEOPAR)
- Ocean Networks Canada (ONC)
- Compute Canada
The Salish Sea MEOPAR NEMO model results are copyright by the Salish Sea MEOPAR Project Contributors and The University of British Columbia. They are licensed under the Apache License, Version 2.0. https://www.apache.org/licenses/LICENSE-2.0
SalishSeaCast 3D Salinity & Temperature
4d salinity and water temperature field values averaged over 1 hour intervals from SalishSeaCast NEMO model runs with physics, biology and chemistry. The values are calculated for the surface of the model grid that includes Juan de Fuca Strait, the Strait of Georgia, Puget Sound, and Johnstone Strait on the coasts of Washington State and British Columbia. The time values are UTC. They are the centre of the intervals over which the calculated model results are averaged.
More information about this dataset, a web interface and an API for it, can be found on the SalishSeaCast ERDDAP server at https://salishsea.eos.ubc.ca/erddap/info/ubcSSg3DTracerFields1hV19-05/index.html
| Variables from source | Derived variables |
|---|---|
| Salinity (PSU) | N/A |
| Conservative Temperature (°C) |
If you use this dataset in your research, please reference it with wording similar to the example below, and include citations of the publications below. Inclusion of the date(s) when you downloaded the dataset, and the dataset id help to ensure reproducibility of your work.
Reference Wording:
Sea surface height fields from the SalishSeaCast model (Soontiens et al, 2016; Soontiens and Allen, 2017) were downloaded from their ERDDAP server (https://salishsea.eos.ubc.ca/erddap/) on DATE from dataset ubcSSgSurfaceTracerFields1hV19-05.
Citations:
-
Soontiens, N., Allen, S., Latornell, D., Le Souef, K., Machuca, I., Paquin, J.-P., Lu, Y., Thompson, K., Korabel, V., 2016. Storm surges in the Strait of Georgia simulated with a regional model. Atmosphere-Ocean 54 1-21. https://dx.doi.org/10.1080/07055900.2015.1108899
-
Soontiens, N. and Allen, S., 2017. Modelling sensitivities to mixing and advection in a sill-basin estuarine system. Ocean Modelling, 112, 17-32. https://dx.doi.org/10.1016/j.ocemod.2017.02.008
The SalishSeaCast project is supported by:
- The Marine Environmental Observation Prediction & Response network (MEOPAR)
- Ocean Networks Canada (ONC)
- Compute Canada
The Salish Sea MEOPAR NEMO model results are copyright by the Salish Sea MEOPAR Project Contributors and The University of British Columbia. They are licensed under the Apache License, Version 2.0. https://www.apache.org/licenses/LICENSE-2.0
SalishSeaCast 2D Sea Surface Height
2d sea surface height values averaged over 1 hour intervals from SalishSeaCast NEMO model runs with physics, biology and chemistry. The values are calculated for the surface of the model grid that includes Juan de Fuca Strait, the Strait of Georgia, Puget Sound, and Johnstone Strait on the coasts of Washington State and British Columbia. The time values are UTC. They are the centre of the intervals over which the calculated model results are averaged.
More information about this dataset, a web interface and an API for it, can be found on the SalishSeaCast ERDDAP server at https://salishsea.eos.ubc.ca/erddap/info/ubcSSgSurfaceTracerFields1hV19-05/index.html
| Variables from source | Derived variables |
|---|---|
| Sea Surface Height (m) | N/A |
If you use this dataset in your research, please reference it with wording similar to the example below, and include citations of the publications below. Inclusion of the date(s) when you downloaded the dataset, and the dataset id help to ensure reproducibility of your work.
Reference Wording:
Sea surface height fields from the SalishSeaCast model (Soontiens et al, 2016; Soontiens and Allen, 2017) were downloaded from their ERDDAP server (https://salishsea.eos.ubc.ca/erddap/) on DATE from dataset ubcSSgSurfaceTracerFields1hV19-05.
Citations:
- Soontiens, N., Allen, S., Latornell, D., Le Souef, K., Machuca, I., Paquin, J.-P., Lu, Y., Thompson, K., Korabel, V., 2016. Storm surges in the Strait of Georgia simulated with a regional model. Atmosphere-Ocean 54 1-21. https://dx.doi.org/10.1080/07055900.2015.1108899
- Soontiens, N. and Allen, S., 2017. Modelling sensitivities to mixing and advection in a sill-basin estuarine system. Ocean Modelling, 112, 17-32. https://dx.doi.org/10.1016/j.ocemod.2017.02.008
The SalishSeaCast project is supported by:
- The Marine Environmental Observation Prediction & Response network (MEOPAR)
- Ocean Networks Canada (ONC)
- Compute Canada
The Salish Sea MEOPAR NEMO model results are copyright by the Salish Sea MEOPAR Project Contributors and The University of British Columbia. They are licensed under the Apache License, Version 2.0. https://www.apache.org/licenses/LICENSE-2.0